Software IPO Analysis
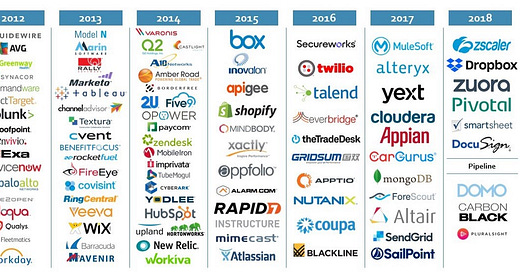
Over 100 software companies have gone public since 2011. In 2018, six new IPOs have priced and several more will before the end of the…
Over 100 software companies have gone public since 2011. In 2018, six new IPOs have priced and several more will before the end of the year. What follows is an analysis that puts these deals in context.

Software companies characteristically have high gross margins, can scale very quickly and are increasingly selling via subscriptions. These key business dynamics have created similarities in the growth and financing dynamics across application, infrastructure, horizontal and vertical software companies that separate them from other technology companies. The companies that survived the 2009 recession and continued to scale and get funded started going public in 2011 and 2012 when the markets began to stabilize and pave the way for a wave of IPOs. The combination of frugality and strength resulted in an IPO class that has performed incredibly well (i.e. Workday, ServiceNow, Palo Alto Networks, Splunk). Large growth investing started gaining momentum in 2015, resulting in an IPO slowdown for the next couple of years as companies preferred to take on additional private capital and delay their IPOs, with several getting acquired in the interim (i.e. AppDynamics). In 2017, we began to see those highly funded companies go public at high valuations. Deal sizes have increased, but not as quickly as market caps, and the lower dilution at IPO represents a trend towards using the IPO as liquidity event rather than a primary funding event. Profitability continues to take a backseat to growth when it comes to valuation, even with larger scale and later stage deals coming to market.
Here’s the data:

IPO Stats by Year

IPOs Priced by Year
2018 is on pace for 18 IPOs this year — the most since 2014.
The rush of IPOs 2012–2014 followed by a 3-year slowdown can be explained by 1) volatile public market conditions and 2) the availability of growth capital.

Deals have gotten gradually larger over the years, but have spiked this year as many of the companies waited to grow into their lofty private valuations prior to going public.

Market cap and deal size are significantly larger during 2018 than in previous periods. At $2.5Bn raised, 2018 has a larger deal volume than every year except 2012. The major difference is the average deal size is over 3x as big, so total raised ends up over $7Bn at the current pace — by far the largest amount raised in a year. This is due almost entirely to the accessibility of growth capital and the later stage of deals.

The gradual decrease in dilution at IPO is affected by the accessibility of late stage capital — due to companies going public later and requiring less primary capital at IPO. The IPO has partially shifted from a fundraising event to more of a liquidity event for many companies’ shareholders (e.g. Spotify).

Operating Metrics at IPO by Year
Companies are going public with larger revenue numbers, but the jump we have seen so far in 2018 is unprecedented. Note that Dropbox at $1Bn of revenue has a big impact on the average, but Pivotal and DocuSign both had over $500M of LTM revenue at IPO. Although growth rates are understandably down, valuation multiples are actually up, showing that the market rewards scale more than it rewards growth.

The companies have gotten bigger and they are going public later, but they are actually less profitable in recent years. Profitability matters less and less to the market as growth at all costs seems to still be the mantra in software.

The largest and smallest groups of IPOs by market cap have the best profitability, but the bulk (80%) of IPOs are below -15% EBITDA margin at IPO.
Now looking at the 2018 IPOs in the context of the previous years’ median stats.

Now let’s look at how the companies have performed after going public.

File to offer is higher than ever, meaning that initial expectations on pricing have been lower than what the market is willing to pay by the time the IPO actually starts trading. The market is hungry for deals that show real upside.
Performance of deals by year shows that IRRs have increased over time as the market has lifted companies and even higher quality companies are going public. The exception here is 2012, where a few great companies bring all the numbers up.

Looking at similar stats here, except through the lens of LTM EBITDA margin at pricing. Companies with 10%+ margins have performed very well, but so have companies with -10% to -35% margins. The lowest performing groups are the highly unprofitable (<-35%) and almost-profitable companies (-10% to 0%). I think this tells us that there is a sweetspot for “growth at all costs.” You don’t want to be too aggressive or not aggressive enough when it comes to investing in growing the business.

These are all the companies by IPO year and absolute share price performance since IPO — either until current or up until when they were acquired. 2012 and 2014 have performed very well and 2017 and 2018 are also doing well so far.

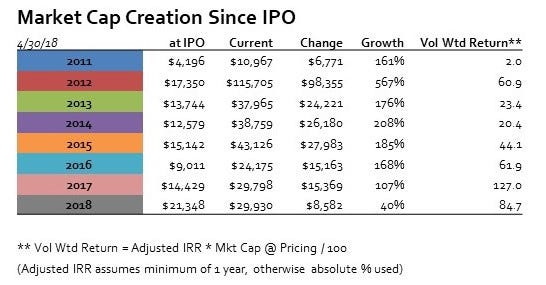
Market cap has been created to an incredible scale by software companies who have gone public over the last few years, representing both great percentage return and dollar return.

This is the same analysis as above, except adjusted for time by looking at IRR instead of absolute performance. I use what I call “Adjusted IRR,” which is simple IRR except for the companies who have been public for less than a year, in which case I use the absolute performance to avoid IRR numbers in the trillions for companies who have only been public for a few days. The top performers from 2012 and 2014 look less impressive here, but the ability to maintain 20–40% IRR for 4–6 years is super impressive and each one has been a great investment as a result. For context, Salesforce has about a 30% IRR since their 2004 IPO.

The bulk of market cap creation has happen with the top performing companies, especially those from 2012.

If we look at the valuation multiples today, we get a view into the quality of companies from each year — and the trend is very positive. Again, even though companies are going public later, they are still rewarded with high multiples in the market despite lower percentage growth rates (see chart above). Adding absolute revenue dollars is the clearest way to maintain a high multiple as it shows both ability to execute and large market potential realized.

As expected, the data shows that on average, companies are going public at higher valuations and later in their lifecycle. The result has been higher valuation multiples, which is impacted by market conditions. More importantly investor demand for new issues of scalable businesses is strong.
Summary thoughts on each year:
2011: 8 IPOs, four of which are still public, but 4 of which are trading at or have been acquired at values less than their IPO value. Ellie Mae has performed incredibly well after pricing 40% below the range. Lowest current and acquired AV/NTM Rev multiple, but ultimately, this is the group of companies that opened up the gates for the current software IPO market.
2012: Key IPOs made it the biggest year: Workday, ServiceNow, Splunk, and Palo Alto Networks. Combined market caps started at $11.2Bn and have grown to $88.8Bn. More than half of the 17 companies have been acquired.
2013: 17 IPOs — the largest being Veeva and FireEye at ~$2.5Bn market cap each. Nearly half (8) of the 17 companies have since been acquired. Wix, Veeva, Ring Central, Tableau and Marketo are all outperformers from this group.
2014: High of 21 IPOs; 5 of them are trading or were acquired below their IPO price. Castlight priced in 2014 while it was growing from $13M to $46M of revenue with a valuation of $1.4Bn (109x LTM Rev). It’s currently down 77% from IPO and these stats skew the 2014 numbers. Only 2 IPOs that year priced above $1Bn — Castlight and New Relic, which has continued to perform well (current mkt cap of $3.9Bn).
2015: The largest IPO was Atlassian, which was already profitable and doing $353M of LTM Revenue — it has since traded up 167%. The 2nd largest IPO of 2015, Inovalon, has been the worst performing — losing 61% of it’s value since IPO. The most impressive IPO of the year was Shopify, which priced at $17/share and $1.2Bn market cap and has since traded up to $134/share and a $14Bn market cap.
2016: Most of the IPOs priced in the 2nd half of the year. Several strong performers including Nutanix and Everbridge, which are up over 200%.
2017: The first year where half of the IPOs priced above $1Bn and 6 of the 12 companies are up over 100%. Notably, Salesforce announced a $6.5Bn deal to buy Mulesoft a year after its IPO, representing a massive multiple and high premium.
2018: The numbers are big as the high flying companies start coming to market. Every IPO so far (and every IPO in the pipeline) was valued over $1Bn at IPO. High multiples and revenue with $428M of average LTM revenue dwarfing the $125 average from 2011–2017.

Taking a look at the broader software we can see impressive performance over the last 4+ years. Horizontal software has performed incredibly well — returning 178% excluding new issuances. Vertical software, Big Data and Security have also performed well, but not nearly to the scale or percentage return of horizontal software, likely due to the inherent market opportunity in the horizontal software space.
M&A

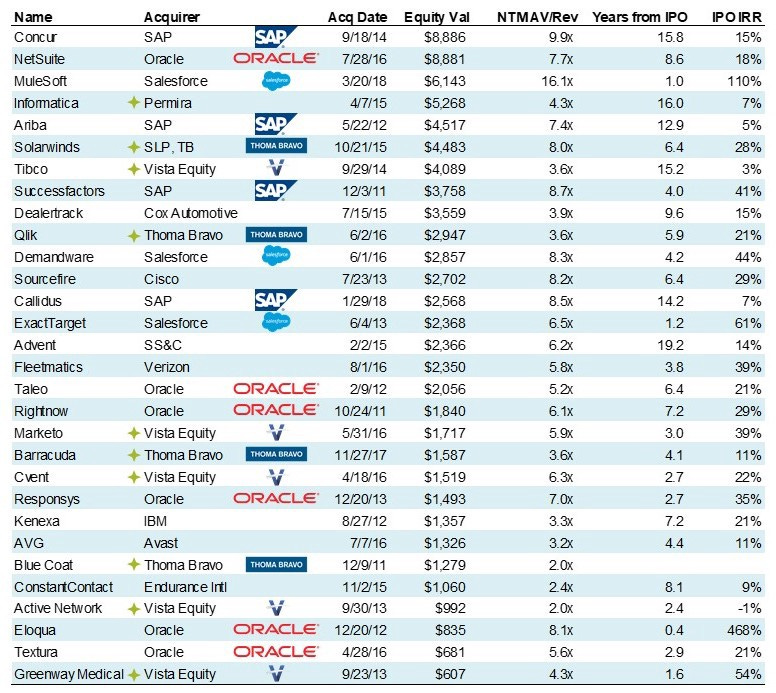
Average time to exit: 2011–4 years, 2012–3.1 years, 2013–3 years, 2014–1.7 years, 2015–1.7 years, 2017–1 year. As expected, it takes a few years for companies to get acquired. In general, it’s the smaller companies getting acquired and returns are not great besides 2012 and 2017. In a large part, this can be attributed to the activity of financial sponsors in the space. Mulesoft is a clear exception and AppDynamics would have been a similar story had Cisco waited for it to go public before acquiring it.

This is a list of the public software M&A above $600M value. The usual suspects — Oracle and SAP — have been highly acquisitive (as is their strategy). Salesforce has more recently adopted a similar strategy of bolt on acquisitions to fuel growth. Financial sponsors, namely Vista Equity and Thoma Bravo have been very active in the space as well. They have deployed $25Bn of capital since 2011 in public deals alone, representing 28% of the capital and 31% of the deals.

Public M&A volume has decreased in part due to companies getting acquired while they are still private. For example, Cisco bought AppDynamics for $3.7Bn shortly after they filed for IPO and before they priced. Whereas companies historically had to go public to prove their value to potential acquirers (like Eloqua in 2012 which was public for 141 days before acquisition), they are now able to achieve even higher M&A multiples while staying private.
It’s an exciting time in the software market. Valuations are high, multiples are aggressive, and high quality companies continue to get started and successfully achieve scale. There are a nearly limitless number of opportunities to improve business with software and we are seeing it happen live. These numbers are just representation the value added by software to the economy every day.
Please send any comments, suggestions or questions.


